Advertisement
YourKit Java Profiler for MAC – Profiling tool specially designed for Java developers. This app was build by YOURKIT Inc. and today updated into the new version. Download this System Utilities app for free now on Apps4Mac.com
YourKit Java Profiler for MAC Latest Version
YourKit Java Profiler for Mac: Free Download + Review [Latest Version]. Before you download the .dmg file, here we go some fact about YourKit Java Profiler that maybe you want to need to know.
Advertisement
| App Name | YourKit Java Profiler App |
| File Size | 86.6 MB |
| Developer | YOURKIT |
| Update | 2021-03-17 |
| Version | 2021.3 |
| Requirement | OS X 10.8.0 |
| License | Paid • One-Time Purchase |
About YourKit Java Profiler App for MAC
YourKit Java Profiler is a reliable profiling tool specially designed for Java developers that need a fully featured CPU and memory profiling app.
Advanced CPU and memory profiling utility for all Java developers
Thanks to YourKit Java Profiler’s powerful analysis capabilities, you can determine CPU and memory hot spots, make comparisons, detect memory leaks, generate memory distribution reports and measure the shallow and retained size of objects.
What is more, the On-demand profiling feature offers you the power to enable profiling only when you need it and keep the application running at full power for the rest of the time. Hence, you can check the current heap state at any given moment by capturing memory snapshots.
Quick and easy installation
To start using YourKit Java Profiler, you just have to download the light archive and extract the application to a location of your choice. Moreover, YourKit Java Profiler seamlessly integrates with most popular IDEs and application servers.
YourKit Java Profiler comes with a user-oriented interface with support for keyboard shortcuts and report filtering for instant and in-depth analysis. The top toolbar helps you capture performance snapshot, initiate or stop the CPU profiling, clear all CPU profiling results, disable Stack telemetry, capture memory snapshots, start memory allocation recording and more.
Detailed graphs and handy filtering options
You also have the power to setup a number of actions that can be triggered by various events, such as high CPU or memory usage or the execution of a given method. The graphs generated in the CPU, Threads and Memory tabs, as well as those from the Garbage Collection and Performance Carts tab are updated in real time.
As follows, you can effortlessly monitor CPU usage, thread count, heap memory, non-heap memory, loaded classes, along with the minor and major collections.
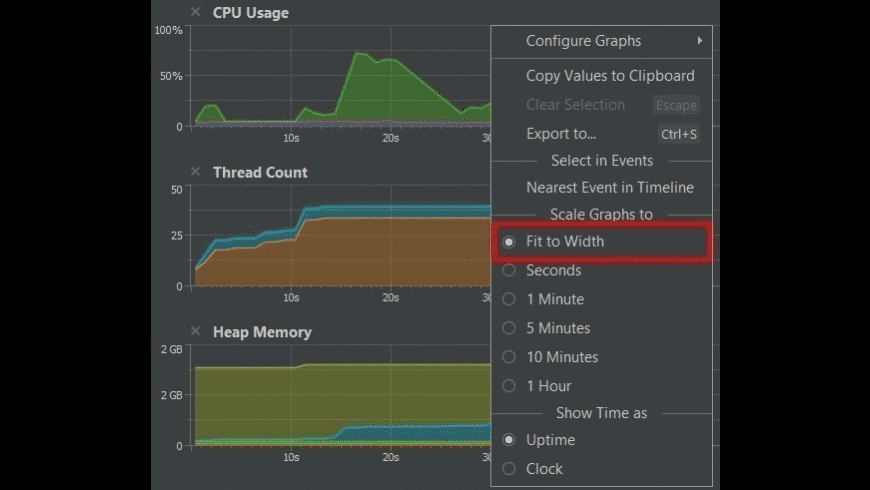 YourKit Java Profiler for MAC Preview/caption]
New Features
Version 2021.3:
Mac on Apple silicon:
- Mac on Apple silicon is now natively supported. The platform is also known as M1, ARM 64, arm64, aarch64.
- Both the profiler agent and the profiler UI run on Apple silicon natively without Rosetta emulation layer.
JVM support:
- JDK 16 supported.
- JDK 7 support deprecated in version 2020.7 was discontinued. The last version supporting Java 7 is YourKit Java Profiler 2020.9.
User interface:
- Remote connection in simple mode explicitly shows an error message if the specified host is invalid instead of informing that no profiled application is found without specifying the reason.
- Callees list renamed to Callee list.
- New activation wizard improves UX of profiler activation and evaluation. The wizard guides through the activation and gracefully handles corner cases when the computer has no Internet connection, is behind a proxy, etc.
- Main menu: the sub-menu Tools | Profile was moved to the top level item Profile.
- The profiler window might not show up because of a slow enumeration of locally running processes.
- Applications matching the development tool filter were not shown in the list even if they were actually profiled, i.e. the agent had been loaded.
- In SSH configuration it was impossible to choose private SSH key from the hidden directory.
- The “system” color theme deprecated in version 2020.7 was finally removed.
Telemetry:
- UI was adopted to support ZGC.
CPU profiling:
- The CPU profiling mode Call counting uses atomic counters to prevent undercounting.
- “Count” column visibility issues when CPU sampling is started in live view.
Memory profiling:
- Profiler is now able to open IBM J9 / OpenJ9 JVM’s Portable Heap Dumps.
- New action Exclude Retained Objects opens a new tab with all the objects from the current set except for the retained set of the current selection. You can find the action in the popup menus of memory views.
- Ignoring retained objects and focusing on the rest might help finding memory leaks and analyze memory distribution.
- Class-specific object presentation: the object explorer immediately shows the library name for instances of java.lang.ClassLoader$NativeLibrary.
- Memory snapshot loading time was greatly improved. The speedup varies from 10% to 20%.
- Array shallow size calculation algorithm for HPROF snapshots was updated to support possible object layouts in JDK 15+.
- The object allocation recording mode “Count allocated objects” uses atomic counters to prevent undercounting.
- The dialog window for the action Memory | Contained Objects shows all options accessible without scrolling.
- Object sizes can be precisely calculated for a HPROF snapshot created with the help of the .snapshot to .hprof converter.
- Other snapshot processing optimizations.
- Object explorer and Quick info might improperly show content of char[].
IDE integration:
- IntelliJ IDEA 2021.1 supported.
- Minimal supported IntelliJ IDEA version is now 2016.1. Support of IntelliJ IDEA 14 and 15 has been removed.
- Minimal supported NetBeans version is now 8.2.
- IntelliJ IDEA: plugin settings were not stored for a project of type “IntelliJ Platform Plugin”.
EE server support:
- Integration wizard supports Tomcat 10.
- Integration wizard no longer supports defunct JRun server.
Triggers:
- Triggers panel: show macro descriptions.
Events:
- JEE 9 (Jakarta EE) supported.
- OpenJPA 3.1 supported.
- EclipseLink 3.0 supported.
- Built-in probes for file I/O and processes were changed to instrument non-native methods only. This allows the probes to work in the attach mode too, in which the instrumentation of loaded native methods is impossible.
Miscellaneous:
- Automatic deobfuscation: source file names are also deobfuscated. This new functionality was added for Zelix KlassMaster (ZKM) and Allatori. It is not available for other obfuscators because their obfuscation logs do not support it.
- Summary tab shows the garbage collection name in the section Garbage collection.
- Summary tab shows the profiled application’s PID.
- Summary tab shows the profiled application’s profiler agent log file path. This can be used for troubleshooting.
- Summary tab shows the profiled application’s environment variables.
- Summary tab shows the profiled application’s working directory.
- Summary tab shows the “Command line” property for a HPROF snapshot too, if available.
- Time measurement improvements in the profiler agent on Linux and macOS.
- The profiler agent automatically applies the startup option skip_advanced_port_check when running under Kubernetes.
- The profiler agent is capable of instrumenting java.lang.Thread.sleep() on all supported JVMs.
- The profiler UI prevents JNA (Java Native Access) framework from loading a native library from PATH instead of the bundled version.
- Attach mode: a harmless exception “Non-numeric value found – int expected” was thrown and logged after successful attach to a Java 11+ JRE instance not having the jdk.attach module.
- Attach mode: Azul Zulu Java 8 JRE could not be attached on macOS.
- Solaris 32-bit agents deprecated in version 2020.9 are no longer supported. Solaris 64-bit Java agents are still supported but declared deprecated.
Deprecations:
- Deprecation means that we intend to remove the feature or capability from a future release of YourKit Java Profiler. The feature or capability will continue to work and is fully supported until it is officially removed.
- Solaris support. This includes the remaining 64-bit agents and the ability to run the profiler UI on this platform.
- HP-UX support.
- Linux ppc 32-bit support. Note that Linux ppc64 (64-bit big endian) and ppc64le (64-bit little endian) remain fully supported platforms.
- AIX ppc 32-bit support. Note that AIX ppc64 (64-bit) remains a fully supported platform.
Installing Apps on MAC
Most Mac OS applications downloaded from outside the App Store come inside a DMG file. Like if you wanna download YourKit Java Profiler for mac from this page, you’ll directly get the .dmg installation file into your MAC.
- First, download the YourKit Java Profiler .dmg installation file from the official link on above
- Double-click the DMG file to open it, and you’ll see a Finder window.
- Often these will include the application itself, some form of arrow, and a shortcut to the Applications folder.
- Simply drag the application’s icon to your Applications folder
- And you’re done: the YourKit Java Profiler is now installed.
- When you’re done installing: just click the “Eject” arrow.
- Then you can feel free to delete the original DMG file: you don’t need it anymore.
- Now, enjoy YourKit Java Profiler for MAC !
You don’t have to put your programs in the Applications folder, though: they’ll run from anywhere. Some people create a “Games” directory, to keep games separate from other applications. But Applications is the most convenient place to put things, so we suggest you just put everything there.
DMG files are mounted by your system, like a sort of virtual hard drive. When you’re done installing the application, it’s a good idea to unmount the DMG in Finder.
Uninstall Apps on MAC
Removing YourKit Java Profiler apps is more than just moving them to the Trash — it’s completely uninstalling them. To completely uninstall a program on MacBook/iMac, you have to choose one of the options on below.
Method 1: Remove apps using Launchpad
Another manual way to delete YourKit Java Profiler apps from your Mac is using the Launchpad. Here’s how it works:
- Click Launchpad icon in your Mac’s Dock.
- Find the YourKit Java Profiler that you want to delete.
- Click and hold the YourKit Java Profiler icon’s until it starts shaking.
- Click X in the top-left corner of the app icon.
- Click Delete.
Method 2: Delete MAC apps with CleanMyMac X
Now it’s time for the safe and quick app uninstalling option. There’s a safest way to uninstall YourKit Java Profiler on Mac without searching all over your Mac, and that’s by using CleanMyMac X.
- Launch CleanMyMac X and click on Uninstaller in the left menu.
- Select the , you can either uninstall it or, if it’s not acting as it should, you can perform an Application Reset.
- Click on Uninstall or choose Application Reset at the top.
- Now that the application cleanup is complete, you can view a log of the removed items, or go back to your app list to uninstall more.
- And you’re done to remove YourKit Java Profiler from your MAC!
YourKit Java Profiler Alternative App for MAC
Here we go some list of an alternative/related app that you must try to install into your lovely MAC OSX
Apple Java
For OS X 10.7 through macOS 10.13.
Download Apple Java for MAC
Java SE Runtime Environment 10
Java runtime environment from Oracle.
Download Java SE Runtime Environment 10 for MAC
Java SE Development Kit 11
Java development kit from Oracle (JDK).
Download Java SE Development Kit 11 for MAC
Disclaimer
This YourKit Java Profiler .dmg installation file is absolutely not hosted in our Server. Whenever you click the “Download” button on this web page, files will downloading straight from the owner sources Official Server. YourKit Java Profiler is an app for MAC that developed by Inc. We are not directly affiliated with them. All trademarks, registered trademarks, item names and company names or logos that mentioned in here are the property of their respective owners. We are DMCA-compliant and gladly to work with you.